The table shows the enrollment projections (in millions) for public universities in theUnited States for the years 2010 through 2012.
Year
Enrollment projections
2010
13.83
2011
14.07
2012
14.23
The data can be modeled by the quadratic function  . Create a system of linear equations for the data. Let t represent the year, with t = 10 corresponding to 2010.
A. 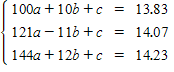
B. ?
C. ?
D. ?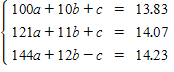
E. ?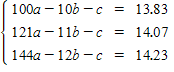
Answer: C
Mathematics
You might also like to view...
Evaluate the line integral along the curve C. ds , C is the path from (1, 1, 0) to (e10, e10, 1) given by:C1: r(t) = e10ti + e10tj, 0 ? t ? 1C2: r(t) = e10i + e10j + 7tk, 0 ? t ? 1
A.  (e30 - 1) + e20 +
  e10
e10
B.  (e30 - 1) + 7e20 + 49e10
C.  (e30 - 1)
D.  (e30 - 1) + 7e20 +
  e10
e10
Mathematics
Estimate. Then find the actual difference.0.2004 - 0.01276
A. Estimate: 0.19; Actual: 0.18864 B. Estimate: 0.19; Actual: 0.18764 C. Estimate: 0.09; Actual: 0.088 D. Estimate: 0.09; Actual: 0.18764
Mathematics
Write an equivalent expression. Use a commutative law.9 + b
A. b9 B. 9(1 + b) C. 9b D. b + 9
Mathematics
Evaluate as instructed.Evaluate (fg)(1).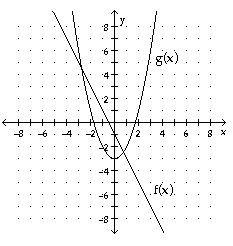
A. -5 B. 0 C. 6 D. 3
Mathematics