First, rewrite each equation in exponential form. Then, use a table of coordinates and the exponential form to graph the logarithmic function. Begin by selecting -2, -1, 0, 1 and 2 for y. Finally, based on your graph, describe the shape of a scatter plot that can be modeled by f(x) = log b x, 0 < b < 1.y = log1/2 x
A. 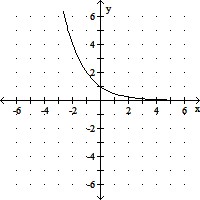
decreasing,
although rate of decrease is slowing down
B. 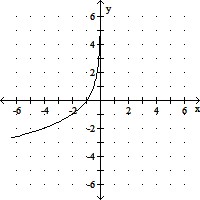
increasing
C. 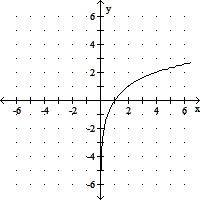
increasing,
although rate of increase is slowing down
D. 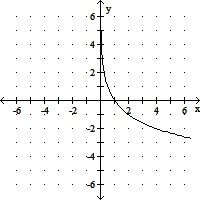
decreasing,
although rate of decrease is slowing down
Answer: D
You might also like to view...
Identify the operation to perform to the equation to isolate the variable.7.34c = 734
A. Multiply by 7.34 B. Subtract 7.34 C. Add 7.34 D. Divide by 7.34
Evaluate the expression.
A. 4 B. 6 C. 1 D. 0
Solve the problem.The paired data below consist of the test scores of 6 randomly selected students and the number of hours they studied for the test. Use the equation of the least squares line to predict the score on the test of a student who studies 11 hours. 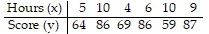
A. 84.1 B. 79.1 C. 83.8 D. 74.1
Solve the problem.The profit that the vendor makes per day by selling x pretzels is given by the function 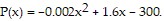 Find the number of pretzels that must be sold to maximize profit.
A. 0.8 pretzels B. 800 pretzels C. 20 pretzels D. 400 pretzels