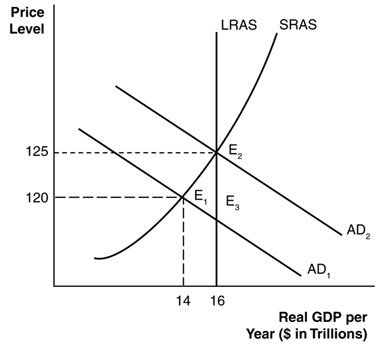
 In the above figure, if the economy is in equilibrium at E1, then
A. there is an inflationary gap in the economy.
B. the economy is producing below its potential long-run equilibrium at full employment.
C. the economy is in a period of high inflation.
D. the economy is producing above its potential long-run equilibrium at full employment.
Answer: B
You might also like to view...
Studies on fast-food stores in Texas and New Jersey suggest that the federal minimum wage law
A. has huge ramifications on unemployment. B. does not have a discernable impact on unemployment. C. causes unemployment for high skilled workers. D. new entrants to the work force search for longer periods.
To show the values of an economic variable for different groups in a population at a point in time, it is best to use a
A) trend-section diagram. B) cross-section graph. C) linear graph. D) time-series graph. E) scatter diagram.
If firms and workers have rational expectations, including knowledge of the policy being used by the Federal Reserve, the short-run Phillips curve will be
A) vertical. B) flatter in the long run than it is in the short run. C) negatively sloped. D) positively sloped.
Antitrust enforcement of vertical relationships is generally focused on
a. The dominant firm using vertical contracts to extend market power to other levels of the supply chain b. Vertical contracts that increase the intensity of competition c. Vertical contracts that help consumers d. All of the above