Give an appropriate answer.The following table shows the average income of families in a certain state from 2008 through 2012. 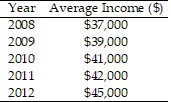 Draw a bar graph that makes the increase look small.
What will be an ideal response?
Answers may vary. One possible solution: 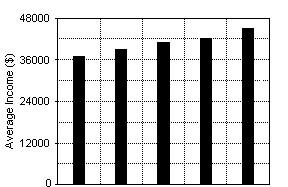
| 2008 | 2009 | 2010 | 2011 | 2012 |
| Year |
Mathematics
You might also like to view...
If ?ABC ? ?XYZ then ?XYZ ? ?ABC by ______________
Fill in the blank(s) with the appropriate word(s).
Mathematics
Solve the equation by clearing the coefficient.-k = 22
A. k = 21 B. k = -22 C. k = 22 D. k = -21
Mathematics
Identify the conic section represented by the equation.4y2 - x2 - 12x + 6y - - 12 = 0
A. hyperbola B. parabola C. ellipse D. circle
Mathematics
Convert the given polar coordinates of the point to rectangular coordinates.(-5, ?)
A. (5, 0) B. (0, 5) C. (0, -5) D. (-5, 0)
Mathematics