In the graph shown, what is the globally-constrained potential output?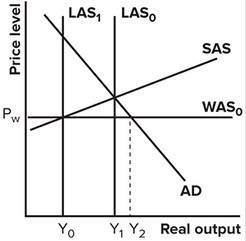
A. Y1
B. Y2 - Y1
C. Y2 - Y0
D. Y0
Answer: D
You might also like to view...
If the quantity of credit supplied in a market exceeds the quantity of credit demanded in the market:
A) the unemployment rate tends to rise. B) the real rate of interest tends to rise. C) the rate of inflation tends to fall. D) the real rate of interest tends to fall.
Why do people specialize and trade?
What will be an ideal response?
Which of the following is most likely to cause the savings supply curve in the market for loanable funds to shift leftward?
A) Government borrows to finance a war. B) All firms project higher future revenue streams for all of their projects. C) All firms project lower future revenue streams for all of their projects. D) Government institutes a high tax on savings.
The authors explain that the marginal cost of production does not have to be constant in order to maximize profits under intemporal price discrimination
Which of the following is NOT an example of changing marginal costs under profit-maximizing intertemporal price discrimination? A) Marginal cost increases sharply after the initial marketing stages when the product is sold to the broader market of consumers. B) Marginal costs decline over time due to learning-by-doing. C) Marginal costs decline over time because the producer sells less expensive versions of the product in later stages of marketing (e.g., hard-cover versus paper-cover books). D) Marginal costs decline over time due to economies of scale.