Refer to the information provided in Figure 2.5 below to answer the question(s) that follow.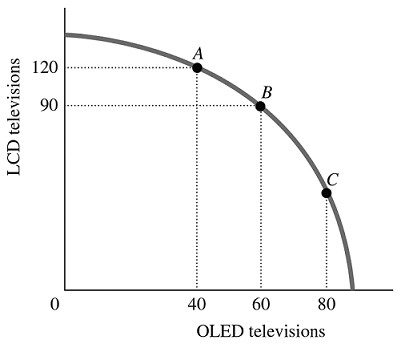 Figure 2.5Refer to Figure 2.5. The economy is currently at Point B. The opportunity cost of moving from Point B to Point A is the
A. 120 LCD TVs that must be forgone to produce 20 additional OLED TVs.
B. 30 LCD TVs that must be forgone to produce 40 additional OLED TVs.
C. 20 OLED TVs that must be forgone to produce 30 additional LCD TVs.
D. 40 OLED TVs that must be forgone to produce 120 additional LCD TVs.
Answer: C
You might also like to view...
If we have information about workers' marginal products, then total and average product can be found by
A) summing the marginal values to find the total and multiplying it times the number of workers to get the average. B) dividing marginal costs by the number of workers. C) summing the marginal values to find the total and dividing it by the number of workers to get the average. D) multiplying the average marginal product times the number of workers.
Figure 11-1
?
 In Figure 11-1, a change in consumer tastes favoring calculators will lead to which movement?
A. A to C B. A to D C. A to B D. A to E
Which of the following events would cause a movement downward and to the left along the supply curve for mangos?
a. The number of sellers of mangos decreases. b. There is an advance in technology that reduces the cost of producing mangos. c. The price of mangos falls. d. The price of fertilizer increases, and fertilizer is an input in the production of mangos.
Consider the supply and demand graph below to answer three questions: (a) Use a letter to identify the area of maximum consumer surplus; (b) Use a letter to identify the area of maximum producer surplus; (c) Why is the output level shown by the vertical
dashed line one that is allocatively efficient from a marginal cost and marginal benefit perspective? What will be an ideal response?