Refer to the information provided in Figure 20.1 below to answer the question(s) that follow.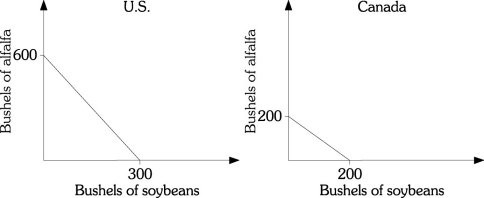 Figure 20.1Refer to Figure 20.1. The opportunity cost of producing a bushel of soybeans in the United States is
A. twice as much as that in Canada.
B. the same as that in Canada.
C. 1/2 as much as that in Canada.
D. 4 times as much as that in Canada.
Answer: A
You might also like to view...
Refer to Table 4-8. If a minimum wage of $10.50 an hour is mandated, what is the quantity of labor demanded?
A) 400,000 B) 370,000 C) 340,000 D) 60,000
Total surplus is represented by the area
a. under the demand curve and above the price. b. above the supply curve and up to the price. c. under the supply curve and up to the price. d. between the demand and supply curves up to the point of equilibrium.
At a given point in time, the Rawlsian welfare function gives equal weight to each individual's utility
Indicate whether the statement is true or false
Refer to the diagram. The equilibrium price and quantity in this market will be:
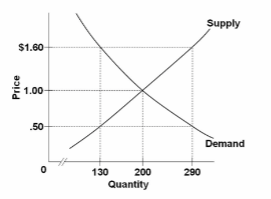
A. $1.00 and 200.
B. $1.60 and 130.
C. $0.50 and 130.
D. $1.60 and 290.