Refer to the information provided in Figure 2.4 below to answer the question(s) that follow.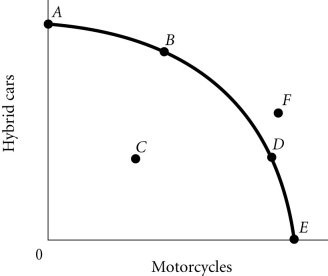 Figure 2.4Refer to Figure 2.4. The economy moves from Point A to Point D. This could be explained by
A. an increase in economic growth.
B. a change in society's preferences for motorcycles versus hybrid cars.
C. a reduction in unemployment.
D. an improvement in technology.
Answer: B
You might also like to view...
Refer to Figure 5-15. The current market equilibrium output is partly the result of overfishing. In that case, what does S1 represent?
A) the social marginal cost of harvesting salmon B) the social marginal benefit of harvesting salmon C) the private marginal cost of harvesting salmon D) the private marginal benefit of harvesting salmon
The law of supply indicates that an increase in price will cause an increase in supply which is reflected graphically as a rightward shift of the supply curve
a. True b. False Indicate whether the statement is true or false
Assume that for good X the supply curve for a good is a typical, upward-sloping straight line, and the demand curve is a typical downward-sloping straight line. If the good is taxed, and the tax is tripled, the
a. base of the triangle that represents the deadweight loss triples. b. height of the triangle that represents the deadweight loss triples. c. deadweight loss of the tax increases by a factor of nine. d. All of the above are correct.
Tom, the manager and owner of a small company, believes in the signaling theory of education, not the human capital theory. As such, we would expect Tom not to offer which of the following company benefits?
a. employer-matching 401k retirement plan contributions b. tuition reimbursement for workers who take college classes c. on-site day care d. health insurance