Graph y = f(x). Compare the graph to the graph of y = log x.y = log(x + 1)
A. Shifted 1 unit(s) downward
B. Shifted 1 unit(s) to the left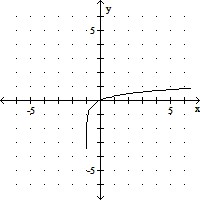
C. Shifted 1 unit(s) to the right
D. Reflected across the y-axis and
shifted 1 unit(s) upward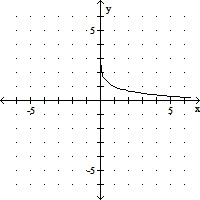
Answer: B
You might also like to view...
Find the slope of a straight line that passes through the given pair of points.(7, 3) and (4, 8)
A. 1
B. - 
C. - 
D. 
Solve the problem.Anne and Nancy use a metal alloy that is 28.2% copper to make jewelry. How many ounces of an alloy that is 23% copper must be mixed with an alloy that is 30% copper to make 105 ounces of the desired alloy?
A. 83 ounces B. 78 ounces C. 27 ounces D. 29 ounces
Suppose that the average adult in the United States will work x number of days (rounded to the nearest day) to earn enough to pay for all of the household's leisure activities in that year. This number can be calculated by multiplying the average percent of household income spent on leisure activities by 365 (the number of days in a year). The bar graph shows the percent of income spent in various countries of the world. Use the graph to answer the question.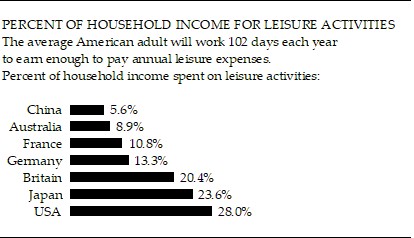 How many days each year will the average adult have to work in order to pay for leisure activities in Japan? Round to the nearest day.
A. 279 days B. 8614 days C. 236 days D. 86 days
Determine if the number is divisible by 2, 3, 5, or none of these.202
A. 3 B. 2 C. 2, 3 D. None