Which graph below best represents the change in the proportion of unstable (parent) radioactive isotopes with time?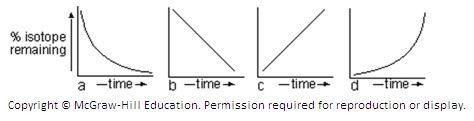
A. Graph a
B. Graph b
C. Graph c
D. Graph d
Answer: A
Environmental & Atmospheric Sciences
You might also like to view...
A beam of light emerges from water into air at an angle bent
A. toward the normal B. in a direction parallel to the normal. C. in a direction perpendicular to the normal. D. away from the normal.
Environmental & Atmospheric Sciences
Lines of latitude are called meridians
Indicate whether the statement is true or false.
Environmental & Atmospheric Sciences
How do fossil fuels contribute to global warming?
A) Burning them breaks the carbon bonds releasing free carbon. B) Burning them breaks the sulfur bonds releasing free sulfur. C) Burning them breaks the nitrogen bonds releasing free nitrogen. D) They have no significant effect.
Environmental & Atmospheric Sciences
The Circle of Illumination bisects Earth's sphere
Indicate whether the statement is true or false
Environmental & Atmospheric Sciences