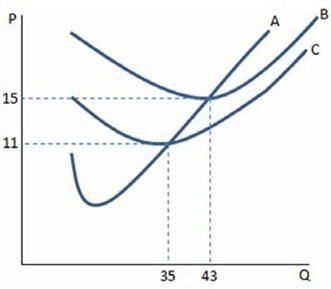
 Of the curves displayed in the graph shown, graph B is most like to be the:
A. ATC curve.
B. AFC curve
C. AVC curve
D. MC curve
Answer: D
You might also like to view...
An open outcry auction is an auction where ________
A) bids are placed privately B) public goods are sold C) bidders know about each other's bids D) free goods are distributed among the general public
In December 2014, the average price of gasoline in the United States was $2.50 per gallon and consumers bought 7 percent more gasoline than they had during April 2014, when the average price was $3.60 per gallon
Based on these numbers, what was the price elasticity of demand for gasoline from April 2014 to December 2014? A) -0.02 B) -0.19 C) -1.01 D) -2.26
When _____ are ______, it will be difficult to reach a private solution
a. transactions costs; high b. transactions costs; low c. externalities; visible d. externalities, invisible
Which of the following is an example of structural unemployment?
A. Alan, a software engineer, lost his job when the internet startup he worked for went bankrupt. He interviewed with five companies in the area before taking a job with another firm in the industry. B. Dora lost her job when the textile factory closed. She does not have skills to work in another industry and has been unemployed for over a year. C. Marsha was laid off from her job with the airline because the recession has reduced the demand for airline travel. She expects to get her job back when the economy picks up. D. Jim had a job as an engineer, but quit when his wife was transferred to another state. He looked for a month before finding a new job that he liked.