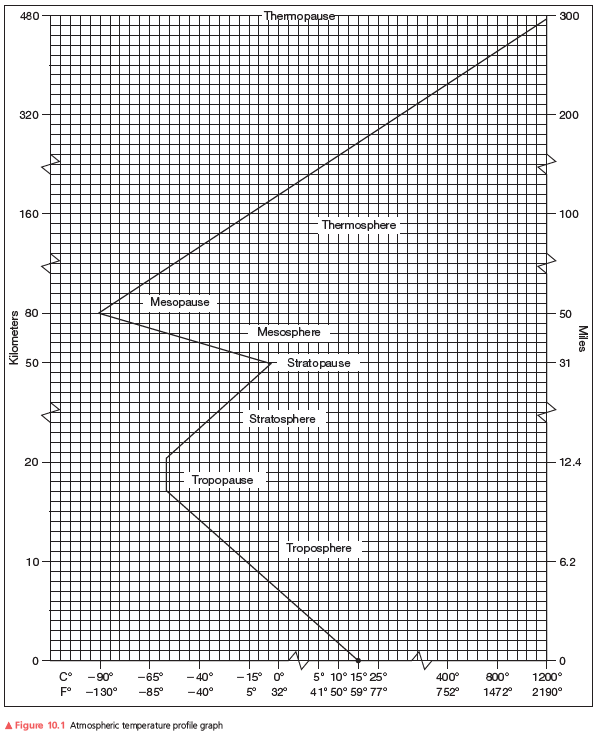
Using the graph in Figure 10.1, plot the standard temperature values given in Table 10.1. (The sea level value has been done for you.) After you plot the data points, connect them with a line graph to complete the profile. Label the layers of the atmosphere and the transition areas at the top of each layer.
Analysis and completion questions about the standard temperature profile.
Environmental & Atmospheric Sciences
You might also like to view...
The utility of a specific place
A) varies directly with its distance from a person's primary place of residence. B) is unaffected by the friction of distance. C) is the same for all people. D) is a measure of the value and importance of that place to a certain person or group.
Environmental & Atmospheric Sciences
A trellis drainage is a tree branchlike pattern of streams. Indicate whether the statement is true or false
Environmental & Atmospheric Sciences
Heat involved in the metamorphic process may come from lava, ____________________ in the crust, or ____________________
Fill in the blank(s) with correct word
Environmental & Atmospheric Sciences
Scrubbers remove 90% of ________
A) acid deposition B) CFCs C) greenhouse gases D) sulfur oxides E) nitrogen oxides
Environmental & Atmospheric Sciences