The graph above shows the relationship between consumption and income. The ratio LM/PL would be a measure of the:
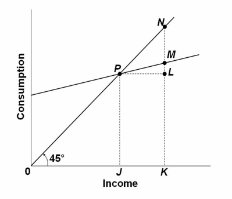
A. Marginal propensity to consume
B. Marginal propensity to save
C. Average propensity to consume
D. Average propensity to save
A. Marginal propensity to consume
You might also like to view...
Because of the presence of asymmetric information problems in credit markets, an expansionary monetary policy causes a ________ in net worth, which ________ the adverse selection problem, thereby ________ increased lending to finance investment
spending. A) decline; increases; encouraging B) rise; increases; discouraging C) rise; reduces; encouraging D) decline; reduces; discouraging
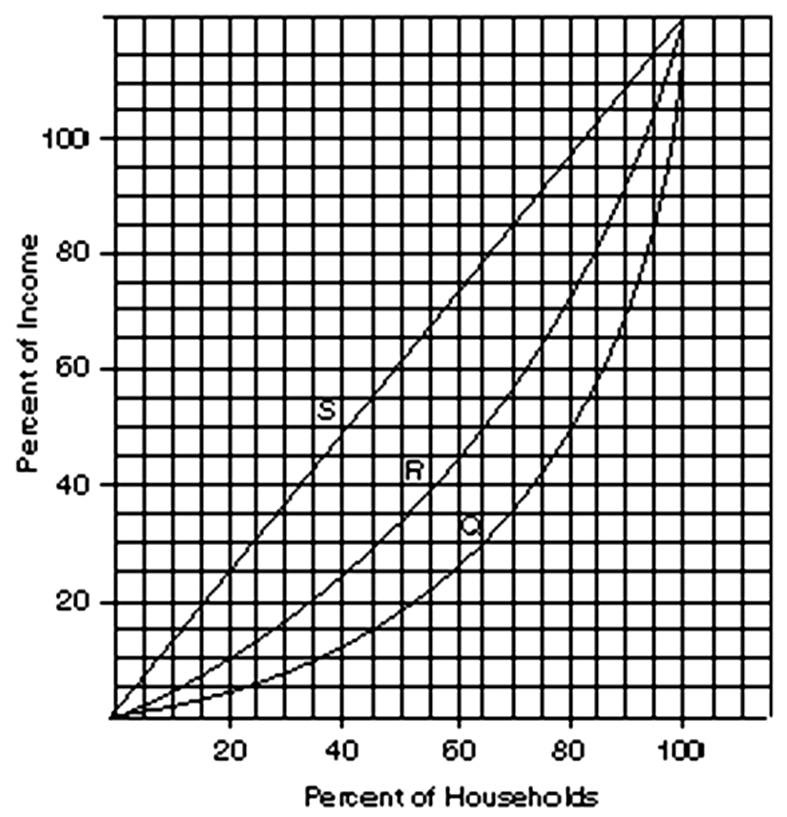
How much is the percentage of income received by the highest quintile on line R?
When estimating a labor demand function, one needs to
A. assume labor demand is equal across states. B. labor supply is perfectly elastic. C. find an instrument (e.g., policy) that shifts labor supply over time or location. D. find an instrument (e.g., policy) that shifts labor demand over time or location. E. assume labor demand is equal across industries.
Refer to the given balance sheets and assume the reserve ratio is 25 percent. Suppose the Federal Reserve Banks buy $2 in securities from the public, which deposits this amount into checking accounts. As a result of these transactions, the supply of money will:
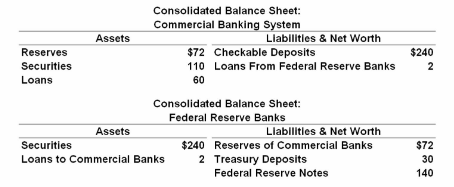
A. be unaffected, but the money-creating potential of the commercial banking system will
increase by $6.
B. directly decrease by $2 and the money-creating potential of the commercial banking
system will be unaffected.
C. directly increase by $8 and the money-creating potential of the commercial banking system
will increase by an additional $32.
D. directly increase by $2 and the money-creating potential of the commercial banking system
will increase by an additional $6.