You conduct an experiment in which you add increasing amounts of substrate to an enzyme solution and then measure
the resulting reaction rate. You plot the rate of the reaction on the Y-axis versus substrate concentration on the X-axis.
What do you conclude from your graph?
a. The reaction rate is independent of substrate concentration.
b. The reaction rate decreases with increasing substrate concentration.
c. The reaction rate is directly proportional to substrate concentration.
d. The reaction rate increases but then decreases, forming a bell-shaped curve.
e. The reaction rate increases with increasing substrate concentration up to a point, above which the rate remains
constant.
e
You might also like to view...
Which of the following reactions is catalyzed by a ribozyme?
A. Last step in electron transport chain (reduction of O2 to form H2O). B. Attachment of amino acid to transfer RNA C. Peptide bond formation during protein synthesis D. First reaction in glycolysis (phosphorylation of glucose)
Amphibians appeared on land about:a
543 million years ago. b. 450 million years ago. c. 420 million years ago. d. 250 million years ago. e. 65 million years ago.
An organic compound that provides instructions for the synthesis or production of polypeptide chains is referred to as which of the following?
A) nucleotide B) lipids C) ATP D) DNA
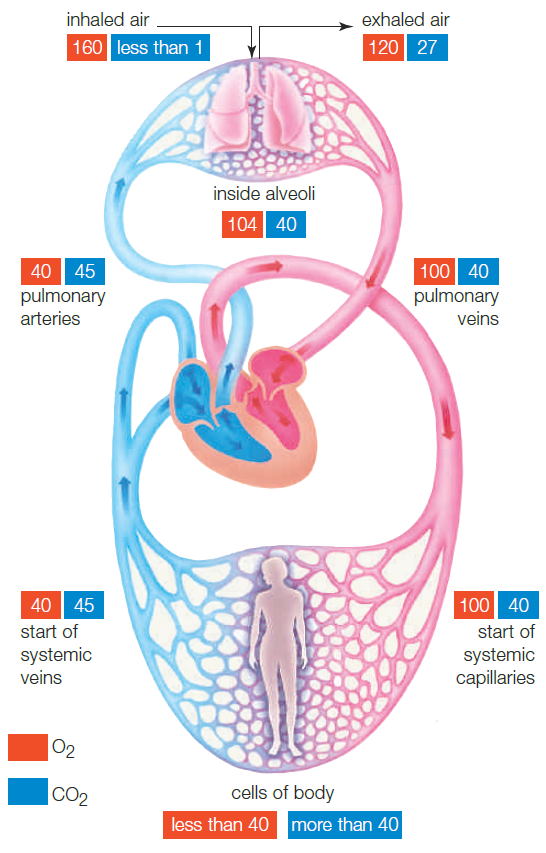 Figure 38.15
?
Use the figure above to answer the following question.
What is the partial pressure of oxygen at the start of the systemic capillary beds?
Figure 38.15
?
Use the figure above to answer the following question.
What is the partial pressure of oxygen at the start of the systemic capillary beds?
A. 40 mm Hg B. 100 mm Hg C. 70 mm Hg D. 104 mm Hg E. 130 mm Hg