The table shows, for some particular year, a listing of several income levels and, for each level, the proportion of the population in the level and the probability that a person in that level bought a new car during the year. Given that one of the people who bought a new car during that year is randomly selected, find the probability that that person was in the indicated income category. Round your answer to the nearest hundredth. 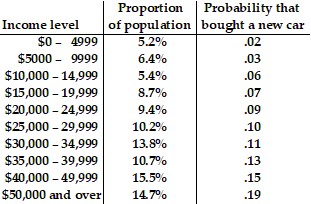 $40,000 - $49,999
A. .21
B. .25
C. .17
D. .22
Answer: A
Mathematics
You might also like to view...
Find the exact value of the trigonometric expression without the use of a calculator.If sin ? = -  ,
,  < ? < 2? and cos ? = -
  , ? < ? <
  , find the exact value of sin (? - ?).
A. 
B. 
C. 
D. 
Mathematics
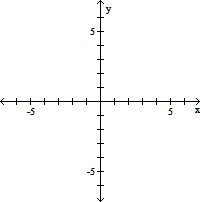
Sketch the graph of the function and its inverse on the same coordinate axes.f(x) = 2 - x2, x ? 0
A. 
B. 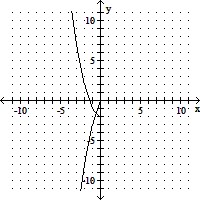
C. 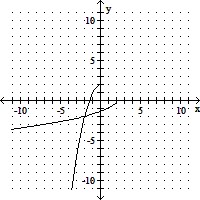
D. 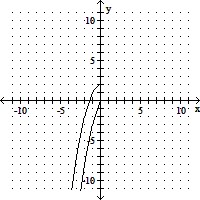
Mathematics
Find the area of the region enclosed by one loop of the curve.
 multiple choice.png)
Mathematics
Graph the function by starting with the graph of the basic function and then using the techniques of shifting, compressing, stretching, and/or reflecting.f(x) = 6
A. 
B. 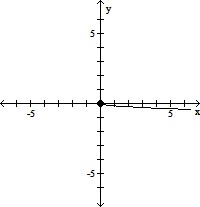
C. 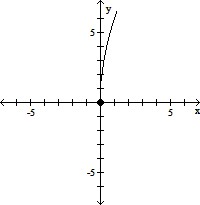
D. 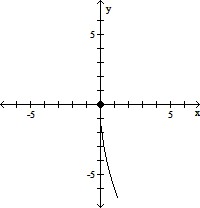
Mathematics