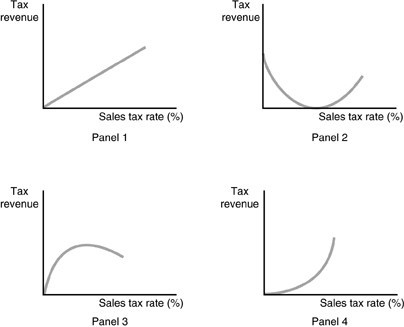
 Refer to the above figures. Which panel represents the expected relationship between tax revenue and the sales tax rate if static tax analysis is used?
A. Panel 1
B. Panel 2
C. Panel 3
D. Panel 4
Answer: A
You might also like to view...
When the government cuts the income tax rate, the real wage rate paid by employers ________ and the real wage rate received by workers ________ and potential GDP ________
A) increases; increases; increases B) decreases; decreases; increases C) increases; decreases; increases D) decreases; increases; decreases E) decreases; increases; increases
The situation in which a person places greater value on a good as fewer and fewer people possess it is called the
A) Bandwagon Effect. B) Greater Value Effect. C) Snob Effect. D) Behavioral Effect.
Suppose that the exchange rate between British pounds and U.S. dollars is originally $2.50 per pound. If it then changes to $3 for 1 pound, the price of U.S. goods to British importers will: a. rise
b. fall. c. stay the same. d. change in an indeterminate direction.
Figure 3-3
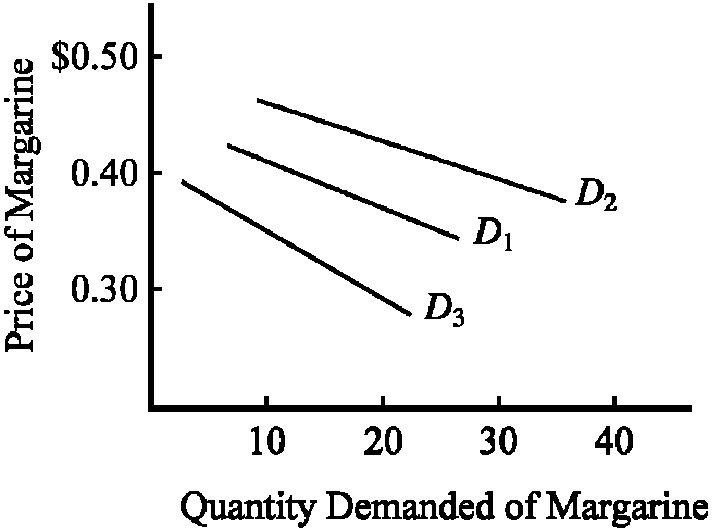
In , if the initial demand for margarine were D1, the impact of an increase in the price of margarine from $0.35 to $0.40 per pound on consumer purchases would be illustrated as
a.
a shift in the demand curve to D2.
b.
a shift in the demand curve to D3.
c.
a movement upward to the left along the original demand curve D1.
d.
none of the above.