Plot and interpret the appropriate scatter diagram.The table gives the times spent watching TV and the grades of several students. 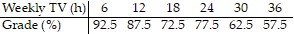 Which scatter diagram describes the data and the relationship, if any?
A. 
More hours spent watching TV may reduce grades.
B. 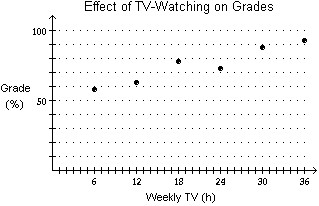
More hours spent watching TV may reduce grades.
C. 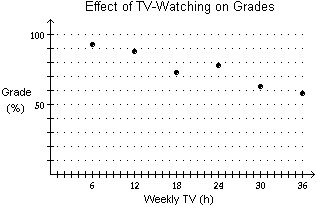
More hours spent watching TV may increase grades.
D. none of these
Answer: A
You might also like to view...
Solve the equation.16w2 - 3w + 1 = 0
A. 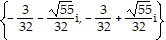
B. 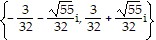
C. 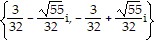
D. 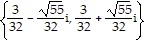
Solve the system.A small airplane traveled 190 mph with a tailwind and 130 mph with a headwind. Find the speed of the wind and the speed of the airplane in still air.
A. speed of the wind was 25 mph, speed of the plane in still air was 155 mph B. speed of the wind was 40 mph, speed of the plane in still air was 150 mph C. speed of the wind was 30 mph, speed of the plane in still air was 160 mph D. speed of the wind was 25 mph, speed of the plane in still air was 165 mph
Find the period.y = 3 sin
A. 3?
B. 2?
C. 
D. 4?
Perform the indicated operations and simplify the result. Leave the answer in factored form. ?
? 
A. - 
B. - 
C. - 
D. 