Sketch the graph of the equation.y =  x2
x2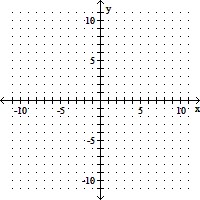
A. 
B. 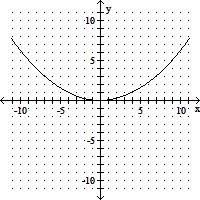
C. 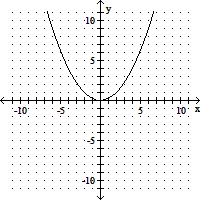
D. 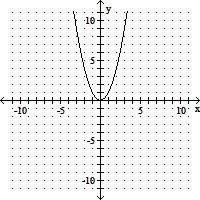
Answer: C
You might also like to view...
Find the indicated partial sum for the sequence.729, -2187, 6561, -19,683, . . . ; S6
A. 265,356 B. -132,678 C. -88,938 D. -177,147
Analyze the graph of the given function f as follows:(a) Determine the end behavior: find the power function that the graph of f resembles for large values of |x|.(b) Find the x- and y-intercepts of the graph.(c) Determine whether the graph crosses or touches the x-axis at each x-intercept.(d) Graph f using a graphing utility.(e) Use the graph to determine the local maxima and local minima, if any exist. Round turning points to two decimal places.(f) Use the information obtained in (a) - (e) to draw a complete graph of f by hand. Label all intercepts and turning points.(g) Find the domain of f. Use the graph to find the range of f.(h) Use the graph to determine where f is increasing and where f is decreasing.f(x) = 8x5 + 36x4 + 36x3
What will be an ideal response?
Solve the problem.The profit that the vendor makes per day by selling x pretzels is given by the function 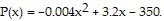 Find the number of pretzels that must be sold to maximize profit.
A. 1.6 pretzels B. 800 pretzels C. 290 pretzels D. 400 pretzels
The slope of the line containing P(-3, -5) and R(-10, -6) is
(a) 11/13. (b) 7. (c) 1/7. (d) 13/11. (e) None of these is correct.