Use the following diagrams for the U.S. economy to answer the next question.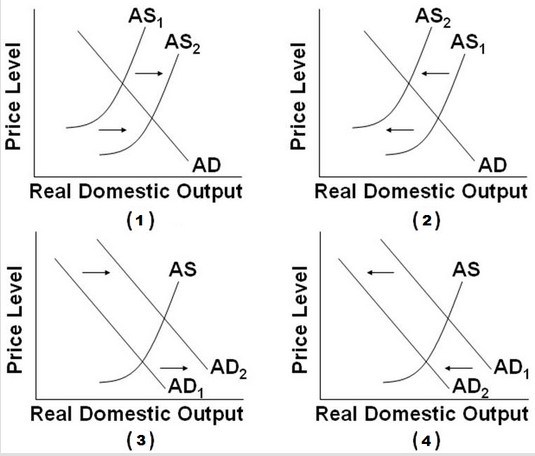 If the economy is initially at full employment, which of the diagrams best portrays a recession as a result of an increase in the cost of production?
A. Graph (1)
B. Graph (2)
C. Graph (3)
D. Graph (4)
Answer: B
You might also like to view...
Player 1 and Player 2 are playing a game in which Player 1 has the first move at A in the decision tree shown below. Once Player 1 has chosen either Up or Down, Player 2, who can see what Player 1 has chosen, must choose Up or Down at B or C. Both players know the payoffs at the end of each branch. 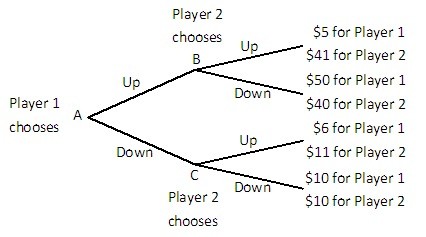 What is the equilibrium outcome of this game?
A. Player 1 and Player 2 both choose Up. B. Player 1 and Player 2 both choose Down. C. Player 1 chooses Down and Player 2 chooses Up. D. Player 1 chooses Up and Player 2 chooses Down.
Infrastructure is capital provided by the private sector. True or False
In the above figure, what is the profit-maximizing price and output?
A) $9, 14 B) $13, 14 C) $11, 16 D) $10, 17
In the market for crude oil, everything held constant, if rate of interest of simple bank accounts or interest-bearing investments decline, then:
a. the consumption of crude oil declines in the present period. b. the extraction of crude oil will increase today. c. the price of the crude oil in the international market falls in the present period. d. greater research and developments are conducted to locate new sites of crude oil in the present period. e. the extraction of crude oil will fall in the present period.