Refer to Figure 11.4. Which diagram illustrates the effect of an increase in the income tax rate?
A) A B) B C) C D) D
B
You might also like to view...
Suppose the growth rate of GDP in the United States is 4.2 percent. If 2.9 percent and 1.3 percent of GDP growth are due, respectively, to capital and labor growth, the amount resulting from technological progress is
A) 0 percent. B) 1.3 percent. C) 2.9 percent. D) 4.2 percent.
During 2009 and 2010, the federal government financed approximately ______ percent of its spending through borrowing. (Fill in the blank)
a. 20 b. 30 c. 40 d. 60
If the closing price of a stock traded on a particular day is $46 per share, and the dividend paid is $2.84 per share
Fill in the blunk(s) with the appropriat word (s).
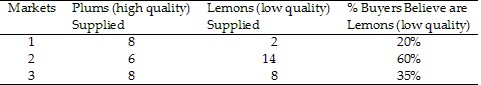 Table 14.2In Table 14.2, Market 3 would be in equilibrium if buyers believed plums account for:
A. 30% of the market. B. 40% of the market. C. 50% of the market. D. 60% of the market.