GDP figures are in billions of dollars.
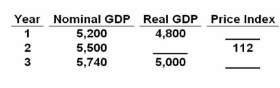
Refer to the above table. What was real GDP in Year 2?
A.
$4,820 billion
B.
$4,875 billion
C.
$4,911 billion
D.
$5,320 billion
C.
$4,911 billion
You might also like to view...
Refer to the scenario above. If Maria's opportunity cost of time increases to $80 per hour, the cost involved in taking the train is:
A) $320. B) $720. C) $800. D) $970.
Jake has already bought his hockey gear for the season, but when he is in the sports store, he falls in love with a different hockey stick and buys it even though it means he can't go out to dinner later with his friends which he would have preferred
. This example illustrates the ________ aspect of behavioral economics. A) bounded rationality B) bounded self-interest C) empowerment effect D) bounded will-power
Which of the following correctly describes the Lorenz curve?
a. The Lorenz curve shows that the increasing income inequality in the U.S. society is actually good for the economy. b. The Lorenz curve shows the growth rate in real median family income over time. c. The Lorenz curve shows the cumulative distribution of family income, ranked from the poorest to the richest families, and compares that curve with the straight line indicating perfectly equal income distribution. d. The Lorenz curve shows the cumulative distribution of family income, ranked from the richest to the poorest families, and compares that curve with the ideal of having all income go to the richest 5 percent of society.
Consider the demand functions: A) Qd = 250 - 2P B) Qd = 300 - 3P. Which of the demand functions reflects a higher level of consumer incomes?
A) A B) B C) A and B reflect the same consumer incomes. D) More information is needed.