The accompanying figure shows the demand curve, marginal revenue curve, marginal cost curve and average total cost curve for a monopolist.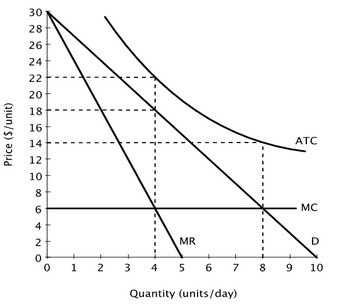 At the socially optimal level of output, this monopolist would:
A. incur an economic loss of $64.
B. incur an economic loss of $112.
C. earn an economic profit of $16.
D. incur an economic loss of $16.
Answer: A
You might also like to view...
The Board of Governors of the Fed:
A. consists of seven state governors who represent the views of individual states in monetary policy. B. consists of seven members appointed by the President of the United States, who together act as the key decision-making entity for monetary policy. C. consists of 13 large commercial bank CEOs who represent the interests of the private banking sector in monetary policy. D. is the primary monetary group responsible for buying and selling bonds designed to change reserves in the banking system. The Board of Governors is the key decision maker for monetary policy.
Suppose you are making $50,000 per year and paying $5,000 per year in income taxes. You get a $10,000 per year raise and your income taxes are now $6,000 per year. Based on this information, the income tax system is
A) proportional. B) progressive. C) regressive. D) bracketed.
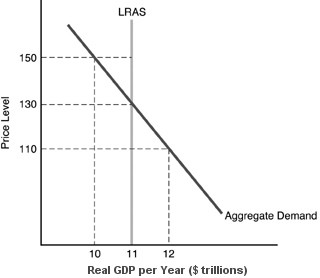 In the above figure, the long-run equilibrium real GDP is
A. $10 trillion. B. $11 trillion. C. $12 trillion D. not displayed.
Which of the following statements about a monopolistically competitive firm is FALSE?
A) It tries to differentiate its product from that of competitors. B) It may earn short-run economic profits. C) It produces the quantity at which MC=MR. D) It sets price like a perfectly competitive firm.