The following graph depicts demand. 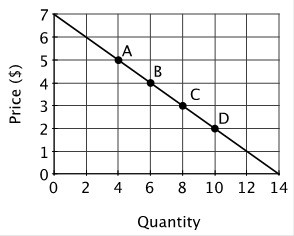 The price elasticity of demand at point A is:
A. 2/5.
B. 8/5.
C. 5/8.
D. 5/2.
Answer: D
You might also like to view...
________ is a period of falling prices of goods and services in an economy
Fill in the blank(s) with correct word
If a firm reacts to other firms' market decisions by anticipating how the other will then react, this is:
a. not profit-maximizing behavior b. a monopolistic competitive market c. a market with a low concentration ratio d. mutual interdependence e. collusion by definition
"Stagflation" refers to the unwelcome combination of
a. inflation and rising prices. b. deflation and unemployment. c. inflation and unemployment. d. inflation and expansion.
Core inflation:
A. measures price changes for the market basket of the average urban consumer with food and energy costs taken out. B. is inflation measured using the producer price index. C. measures the changes in prices for the entire market basket of the average urban consumer. D. is inflation measured using the retail price index.