This double-bar graph shows the number of male (M) and female (F) athletes at a university over a four-year period. Answer the question.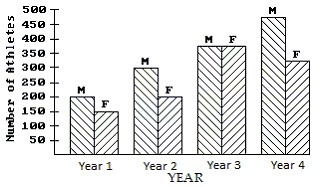 Which year had the smallest number of male athletes?
A. Year 2
B. Year 4
C. Year 3
D. Year 1
Answer: D
You might also like to view...
Solve. Round to the nearest whole if necessary.20% of the teachers in a school are male. If there are 1050 teachers altogether, how many teachers are male?
A. 2 teachers B. 840 teachers C. 210 teachers D. 5250 teachers
Evaluate the expression.5 ? [2 + 4 ? (7 + 3)]
A. 296 B. 210 C. 50 D. 300
Solve the problem.In a survey about the number of siblings of college students, the following probability table was constructed: 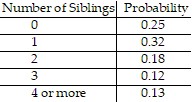 What is the probability that a student has at most 2 siblings?
A. 0.43 B. 0.57 C. 0.75 D. 0.25
Find the requested probability.A coin is biased to show 45% heads and 55% tails. The coin is tossed twice. What is the probability that the coin turns up heads on the second toss?
A. 55% B. 45% C. 20.25% D. 24.75%