Figure 10-7
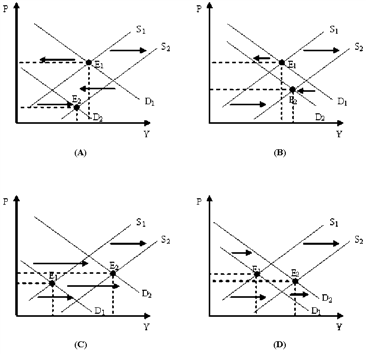
Refer to Figure 10-7. Which of the diagrams in Figure 10-7 represents a period of economic growth and inflation?
a.
Panel (A)
b.
Panel (B)
c.
Panel (C)
d.
Panel (D)
c
You might also like to view...
What does the slope of the credit demand curve imply? When do movements along a credit demand curve occur?
What will be an ideal response?
Relative to simple pricing, price discrimination leads to
a. Consumer surplus being converted to producer surplus b. Increased profits c. A simplified pricing schedule d. Both a and b
The aggregate demand curve will shift rightward when there is:
A. a decrease in government spending. B. a decrease in incomes abroad. C. a tax increase. D. the expectation that future consumer income will rise.
The supply of a country’s currency arises from its imports and from foreign investment by its own citizens.
Answer the following statement true (T) or false (F)