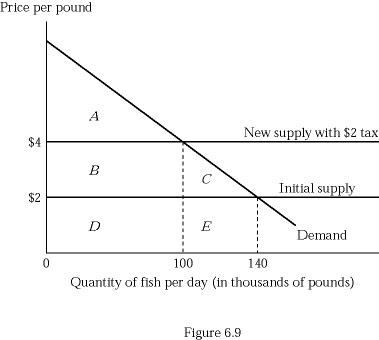
 Figure 6.9 depicts a hypothetical fish market with a horizontal supply curve. Suppose the government imposes a tax of $2 per pound of fish, and the tax is paid in legal terms by producers. Which of the following shows the difference between the total burden of the tax and the amount of revenue collected by the government?
A. Triangle A
B. Rectangle B
C. Triangle C
D. Rectangle E
Answer: C
You might also like to view...
The dominance of banks in Germany comes at the expense of __________ markets there
A) securities B) government bond C) consumer borrowing D) foreign exchange
Which of the following do development economists NOT recommend to nations seeking to increase their rates of economic growth?
A) protecting home producers from international competition B) letting creative destruction run its course C) promoting increased education D) promoting private property rights
A monopolist is a price maker.
Answer the following statement true (T) or false (F)
If economies of scale are relatively unimportant in an industry, the typical firm's long-run average total cost curve will reach a minimum at a level of output that is a ________ fraction of total industry sales. The industry will be ________
A) large; competitive B) large; an oligopoly C) small; competitive D) small; an oligopoly