Solve the problem.The table shown was generated by a graphing calculator. The functions defined by y1 and y2 are linear. Based on the table, find the equation for y2.
A. y2 = -x + 3
B. y2 = -x + 9
C. y2 = 2x + 3
D. y2 = 2x + 9
Answer: B
You might also like to view...
Sketch the graph and show all local extrema and inflection points.y = x + sin x, 0 ? x ? 2?
A. Local minimum: (0, 0)
Local maximum: (2?, 2?)
Inflection point: (?, ?)
B. Local minimum: (0, 0)
Local maximum: (2?, 2?)
No inflection points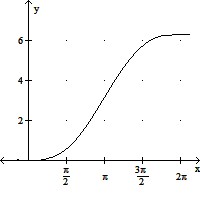
C. Local minimum: (0, 0)
Local maximum: (2?, 2?)
Inflection point: (?, ?)
D. Local minimum: (0, 0)
Local maximum: (2?, 2?)
No inflection points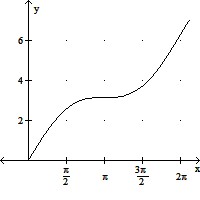
Write the whole number in standard form.60,000 + 300 + 10
A. 60,310 B. 6301 C. 30,160 D. 631,000
The graph of a function f is given. Use the graph to answer the question.Find the values of x, if any, at which f has a relative minimum. What are the relative minima?
A. f has no relative minimum B. f has a relative minimum at x = -2; the relative minimum is 0 C. f has a relative minimum at x = 0; the relative minimum is 2 D. f has a relative minimum at x = -2 and 2; the relative minimum is 0
Perform the following operation.
?
 ?
?
A. 20 B. -30 C. 5 D. -15 E. 15