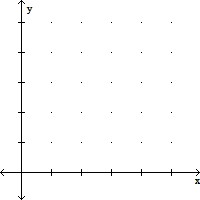
Solve the problem.The table below shows the population of a city in various years. Use the data to draw a graph of the population as a function of time. Use the graph to estimate when the population reached 6.4 million 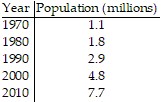
A. 2005
B. 2004
C. 2007
D. 2006
Answer: D
Mathematics
You might also like to view...
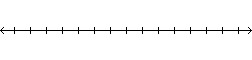
Solve the inequality. Graph the solution set and write the solution set in set-builder notation.4x2 + 17x - 15 < 0![]()
A. 
![]()
B. 
![]()
C. 
![]()
D. 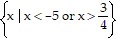
![]()
Mathematics
Rationalize the denominator.
A.  -
- 
B. 
C.  -
- 
D.  +
+ 
Mathematics
Solve and graph.-4 ? 
A. b < -28
![]()
B. b > -28
![]()
C. b ? -28
![]()
D. b ? -28
![]()
Mathematics
The probability that a certain couple will have a blue-eyed child is  , and they have 5 children. What is the probability that none of their children have blue eyes? Round your answer to six decimal places.
?
, and they have 5 children. What is the probability that none of their children have blue eyes? Round your answer to six decimal places.
?
A. Pr(0 Blue) = 0 B. Pr(0 Blue) = 0.001978 C. Pr(0 Blue) = 0.000260 D. Pr(0 Blue) = 0.000648 E. Pr(0 Blue) = 1
Mathematics