The graph shows the number of tickets sold each week by the garden club for their annual flower show.?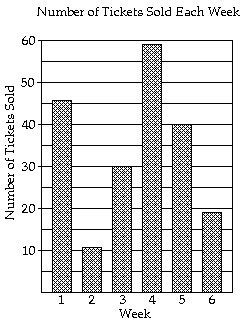 If 20% of the tickets sold during the third week were sold to men, how many men bought tickets during the third week?
A. 60 men
B. 15 men
C. 6 men
D. 150 men
Answer: C
You might also like to view...
Find the vertices of the hyperbola.4y2 - x2 - 40y + 8x + 80 = 0
A. (-6, -5) and (-2, -5) B. (4, 6) and (4, 4) C. (-4, -4) and (-4, -6) D. (2, 5) and (6, 5)
Find the maximum or minimum value of the given objective function of a linear programming problem. The figure illustrates the graph of the feasible points.z = 7x + 8y. Find maximum and minimum. 
A. maximum value: 98; minimum value: 24 B. maximum value: 66; minimum value: 21 C. maximum value: 98; minimum value: 21 D. maximum value: 66; minimum value: 24
Determine where the function is increasing and where it is decreasing.f(x) = x2 - 12x + 36
A. increasing on (-6, ?) decreasing on (-?, -6) B. increasing on (6, ?) decreasing on (-?, 6) C. increasing on (-?, -6) decreasing on (-6, ?) D. increasing on (-?, 6) decreasing on (6, ?)
Arrange in increasing order. ,
,  ,
, 
A.  ,
,  ,
, 
B.  ,
,  ,
, 
C.  ,
,  ,
, 
D.  ,
,  ,
, 