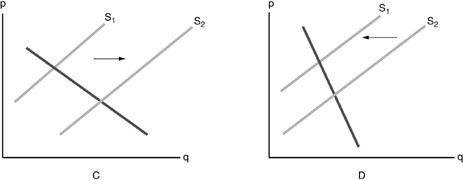
 Refer to the above figure. Which diagram shows the effect on the market of cellphones when the demand for cellphones has increased?
A. graph C
B. graph D
C. neither graph
D. both graphs
Answer: C
You might also like to view...
Answer the following statement(s) true (T) or false (F)
1. On average over all goods, it has been found that as people become wealthier, expenditures for higher quality grow more rapidly than expenditures for increased quantity. 2. The cross elasticity between California and Florida oranges is likely to be negative because they are substitutes for one another. 3. If the cross price elasticity of demand is negative, then the two goods under consideration must be complements. 4. If the cross-price elasticity for oranges with respect to apples is 1.2 and the price of apples increase by 5%, then we can expect the quantity demanded of oranges to decrease by 6%.
The nominal wage is the wage rate adjusted for changes in the price level
Indicate whether the statement is true or false
Producers want to calculate the price elasticity of demand because they want to:
A. know the goods and services for which consumers are most sensitive to price changes. B. be able to predict the future preferences of their customers. C. know that consumers will have the same response to a price change regardless of the good or service. D. understand what goods their customers dislike the most.
Plurality voting fails which of the criteria for an ideal voting system?
A. Transitivity B. No dictator C. Unanimity D. Independence of irrelevant alternatives