Refer to the graph shown. With an effective price floor at Pf, the effect is an implicit tax on: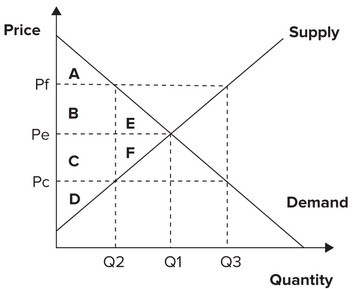
A. consumers shown by area B and a subsidy to suppliers of that area.
B. consumers shown by area C and a subsidy to suppliers of that area.
C. suppliers shown by area B and a subsidy to consumers of that area.
D. suppliers shown by area C and a subsidy to consumers of that area.
Answer: A
You might also like to view...
Which of the following statements is true?
A) If households expect higher taxes in the future, they will decrease their current savings rate. B) The savings rate of households is dependent only on current consumption expenditure. C) The savings rate of households is dependent only on consumption expenditure planned for the future. D) If households expect higher taxes in the future, they will increase their current savings rate.
The production possibilities curve demonstrate which of the following concepts?
A) scarcity B) choice C) trade-offs D) all of the above
A city in which 320,000 persons are employed has a labor force of 359,500 persons. The unemployment rate for the city is: a. 7.8 percent
b. 11.0 percent. c. 12.3 percent. d. 14.5 percent.
Thomas Edison once complained that he was not making a profit selling light bulbs because his plants were operating 25 percent below capacity. He estimated that he could increase output 25 percent with a 2 percent increase in the cost of production. He sold the 25 percent on the foreign market at a price below what he called the "cost of production." We can deduce that Edison really meant
a. Marginal cost was below average cost but less than marginal revenue. b. Average cost exceeded variable cost, which exceeded marginal revenue. c. Variable cost exceeded fixed cost but was less than marginal revenue. d. Marginal cost was above average cost but greater than marginal revenue.