For a country that produces two goods: Environmental clean-up goods and space program goods. What economic information is contained in its production possibility curve?
What will be an ideal response?
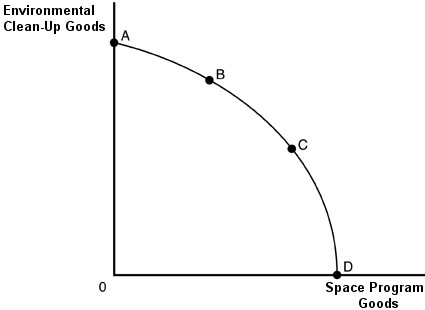
The above figure illustrates the production possibility curve, which divides the area into two parts. The area beyond the PPC is unattainable, illustrating the concept of scarcity. The curve slopes down, indicating the fact that the only way to apply more resources to producing space program goods is to devote fewer resources to producing environmental clean-up goods. It is bowed out, illustrating increasing opportunity cost. Efficiency is illustrated when society is on the PPC rather than inside it.
You might also like to view...
Suppose that a perfectly competitive industry is in long-run equilibrium, and demand increases. Explain the short- and long-run effects on the firm and the industry
What will be an ideal response?
When measuring economic growth, economists typically focus on per capita real GDP in order to account for variations in the:
a. size of the population b. price level c. quality of goods and services d. both (a) and (b) above
When new firms have an incentive to enter a competitive price-taker market, their entry will
a. increase the price of the product. b. drive down profits of existing firms in the market. c. shift the market supply curve to the left. d. increase demand for the product.
If over a period of time real gross domestic product (GDP) increases while nominal GDP decreases, then this implies
a. a significant rise in the price level. b. a significant drop in the price level. c. that real GDP is higher than nominal GDP. d. that the given period occurs before the base period. e. that the given period year occurs after the base period.