The following table shows the approximate number of males of Hispanic origin employed in the U.S. in 2005, broken down by age group. In what age interval does the empirical rule predict that 68 percent of all male Hispanic workers will fall? Please round answers to the nearest year.
Age15 - 24.925 - 54.955 - 64.9Employment (thousands)16,00013,0001,600??
A. 31 - 42
B. 19 - 31
C. 19 - 42
D. 12 - 31
E. 12 - 42
Answer: C
You might also like to view...
Rank the data from lowest to highest and determine the requested quartile.The following scores on the midterm exam in Chemistry 102 were recorded.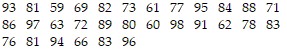 Find the 3rd quartile, Q3.
A. 88 B. 89 C. 75 D. 86
Use the diagram to find the domain and range of f.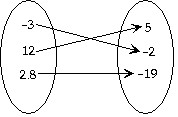
A. D = {-3, 12} R = {-19, -2, 5} B. D = All real numbers R = All real numbers C. D = {-19, -2, 5} R = {-3, 2.8, 12} D. D = {-3, 2.8, 12} R = {-19, -2, 5}
For the demand equation  where x represents the quantity demanded in units of a thousand and p is the unit price in dollars, determine the quantity demanded when the unit price is set at $6.
?
where x represents the quantity demanded in units of a thousand and p is the unit price in dollars, determine the quantity demanded when the unit price is set at $6.
?
A. x = 400 units B. x = 3,000 units C. x = 4,000 units D. x = 40 units E. x = 2,000 units
Use substitution to determine whether the given number is a zero of the given polynomial.-1; f(x) = -x4 + 4x2 + 5x + 2
A. Yes B. No