The figure below represents the effects in the labor markets due to migration. Here, the world has been divided into a high-income "North" (left panel) and a low-income "South" (right panel). Dn and Sn are the labor demand and the labor supply curves in North. Ds and (Sr + Smig) are the labor demand and pre-migration labor supply curves in South. Sr is the post-migration labor supply curve in South. The value c is the cost of migrating.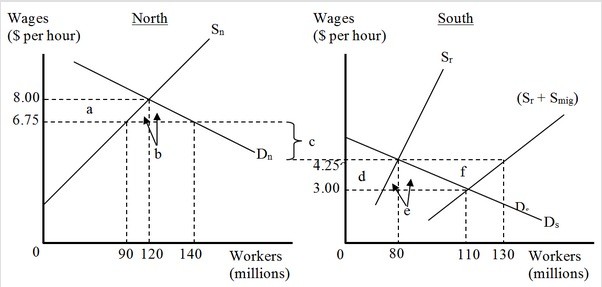 As an effect of the migration, the native employees in North
A. lose welfare given by area a.
B. lose welfare given by area (a + b).
C. gain welfare given by area (a + b).
D. lose welfare given by area (e + f).
Answer: A
You might also like to view...
Suppose the price of coffee is $3 each, the price of bagels is $2 each and a person's budget is $40. The relative price of coffee is
A) 1.5 bagels. B) 2/3 of a bagel. C) 13.33 bagels. D) 20 bagels.
Which of the following statements is correct?
a. The United States has a more equal distribution of income than other developed countries such as Japan and Germany. b. The statement "a rising tide lifts all boats" illustrates how economic growth reduces the number of people with income levels below the poverty line. c. The economic life cycle explains why people base spending decisions on transitory income. d. The United States has more income inequality than developing countries, including Mexico and Brazil.
Consider the following regression equation: y=  0+ 1x1+ …+ kxk + u
In which of the following cases, the dependent variable is binary? A. y indicates the gross domestic product of a country B. y indicates whether an adult is a college dropout C. y indicates household consumption expenditure D. y indicates the number of children in a family
Check collection and clearing happen
A. at the Fed and at private clearing centers. B. only at private clearing centers. C. only at the Fed. D. at the bank where the check was written.