Use the Venn diagram below to find the number of elements in the region.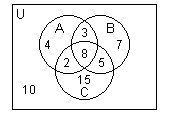 n(C')
n(C')
A. 39
B. 24
C. 14
D. 29
Answer: B
Mathematics
You might also like to view...
Evaluate. Simplify if possible. -  -
- 
A. - 
B. 
C. - 
D. - 
Mathematics
Graph the inequality.x2 + y2 ? 36
A. 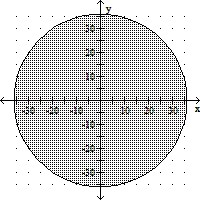
B. 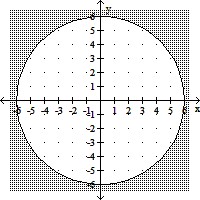
C. 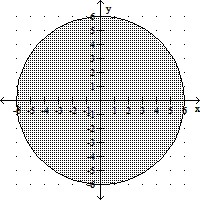
D. 
Mathematics
Solve the problem.The following data set gives the average home value, in dollars, for a city at 5-year intervals. Determine where f is increasing or decreasing.
A. f is decreasing for the given x values. B. f is increasing until 1980, then f is decreasing for remainder of x-values. C. f is constant for the given x-values. D. f is increasing for the given x-values.
Mathematics
Find the exact value by using a half-angle identity.sin 22.5°
A. 

B. - 

C. 

D. - 

Mathematics