Refer to Figure 2-16. One segment of the circular flow diagram in the figure shows the flow of goods and services from market C to economic agents A. What is market C and who are economic agents A?
A) C = factor markets; A = households B) C= product markets; A = firms
C) C = factor markets; A = firms D) C = product markets; A = households
D
You might also like to view...
In the United States today, the government will exchange gold or silver for paper money
Indicate whether the statement is true or false
Where it can function, a market for pollution rights can serve to internalize the air-pollution externality
Indicate whether the statement is true or false
If a person is risk averse, then as wealth increases, total utility of wealth
a. increases at an increasing rate. b. increases at a decreasing rate. c. decreases at an increasing rate. d. decreases at a decreasing rate.
Using Figure 1 above, if the aggregate demand curve shifts from AD1 to AD2 the result in the long run would be: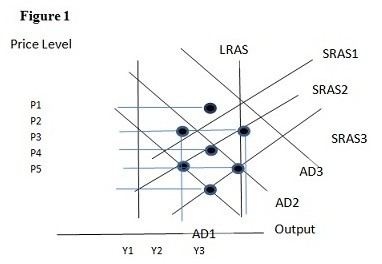
A. P1 and Y2. B. P2 and Y2. C. P3 and Y1. D. P2 and Y3.