To answer the question, refer to the following table showing a demand schedule: 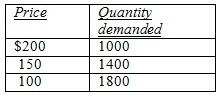 If price falls from $150 to $100,
A. an arrow representing the price effect points down and is shorter than an arrow for the quantity effect.
B. arrows representing the price and quantity effects both point down.
C. total revenue moves in the same direction as the arrow representing the price effect.
D. the arrow representing the price effect points down and the arrow representing the quantity effect points up.
E. both c and d
Answer: E
You might also like to view...
In the absence of the negative externality from each individual's contribution to road congestion, roads would not be congested (aside from congestion caused by accidents).
Answer the following statement true (T) or false (F)
A scatterplot allows us
A) to mark peaks and troughs. B) to determine whether a series leads or lags. C) to see the comovement between two time series. D) to determine how persistent a series is.
Political business cycles which are the results of economic fluctuations that occur when discretionary policy is manipulated for political gain
Indicate whether the statement is true or false
If total costs are $50,000 when 1000 units are produced, and total costs are $50,100 when 1001 units are produced, we can conclude that
A) average variable costs are $100. B) average total costs are $100. C) average fixed costs are $100. D) marginal costs are $100.