Predict the number of tick marks on the positive x - axis and the positive y-axis.[-60, 60, 6] by [-84, 66, 6]
A. 25; 20
B. 20; 25
C. 11; 10
D. 10; 11
Answer: D
You might also like to view...
For the function f whose graph is given, determine the limit.Find f(x).
f(x).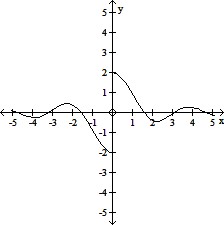
A. does not exist B. 2 C. -2 D. 0
Solve. The FDA approves a new drug and has confirmed by independent research that the strength of the reaction to the drug is given by the expression  where d is the dosage of the drug and ? is a constant. Factor this expression.
A. d2
B.  (? - d)
C. d2
D. 

Provide an appropriate response. Which type of statistical graph best shows how a whole quantity is related to its parts?
A. circle B. line C. bar D. table
Solve.Find the equilibrium point for the given supply and demand functions. Here y represents price and x represents quantity. y = 645 - 3x (demand) y = 5x - 731 (supply)
A. -731, $645 B. 129, $172 C. 642, $736 D. 172, $129