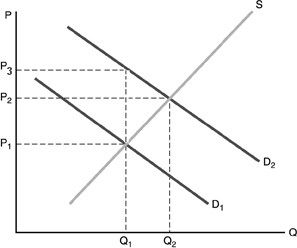
 Refer to the above figure. The market equilibrium quantity is Q1. Point Q2 represents the optimal amount of production. The government can achieve the optimal outcome by
A. setting the price at P3.
B. establishing a tax equal to P2 - P1 per unit of the good sold.
C. providing a per-unit subsidy to consumers equal to P2 - P1.
D. providing a per-unit subsidy to consumers equal to P3 - P1.
Answer: D
You might also like to view...
Kristen has an income of $450 per year to spend on music CDs and movies on DVDs. The price of a CD is $15. The indifference curves in the figure above (I1, I2, and I3 ) reflect Kristen's preferences. If the price of a DVD is $22
50, then Kristen buys ________ DVDs; if the price of a DVD is $18.00, then Kristen buys ________ DVDs. A) 12; 14 B) 5; 10 C) 10; 15 D) 7.5; 12.5
Headline inflation is:
A. core inflation with the prices of food and gasoline added in. B. limited measure of inflation in the economy. C. used only by the media for discussing inflation. D. not a generally accepted measure of inflation.
If the Dow Jones Industrial Average is currently at 10,000 and the price of one stock included in the index increases by $10, the Dow Jones Industrial Average will:
A. increase by 10.0%. B. increase by 1.0%. C. increase by 0.1%. D. not change; it is a value-weighted index.
In recent times, the price of oil has risen dramatically. Economic analysts currently are focusing on questions concerning the likely impacts of this price increase on the U.S. economy. The branch of economics that deals with this situation (i.e., what
will be questions) is called ________ economics. Fill in the blank(s) with correct word