Use the following graph to answer the next question.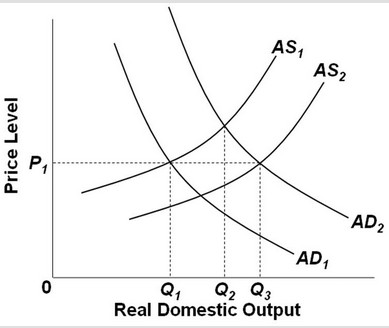 In the figure, AD1 and AS1 represent the original aggregate supply and demand curves. If Q1 is full-employment output, then AD2 and AS1 represent a(n) ________.
A. full-employment
B. price stability
C. expansion
D. recession
Answer: C
You might also like to view...
Suppose in the United States, the opportunity cost of producing a motor engine is 4 auto bodies. In Canada, the opportunity cost of producing a motor engine is 2 auto bodies
a. What is the opportunity cost of producing an auto body for the United States? b. What is the opportunity cost of producing an auto body for Canada? c. Which country has a comparative advantage in the production of auto bodies? d. Which country has a comparative advantage in the production of motor engines?
Refer to Figure 10.3. A positive demand shock with no change in the real interest rate is best represented by ________ in panel (a) and ________ in panel (b)
A) a shift from AE3 to AE2; a shift from IS2 to IS1 B) a shift from AE2 to AE3; a shift from IS1 to IS2 C) a shift from AE1 to AE2; a movement from point A to point B D) a shift from AE1 to AE3; a movement from point A to point C
The conditions in which vertical relationships can enhance a firm's ability to price discriminate include
a. the manufacturer's product is of value to just one type of customer b. the costs of arbitraging the price difference across markets is large c. the manufacturer acquires the distributer in the higher priced market d. lack of competition provides the manufacturer with the ability to price above marginal cost
Which of the following firms is most likely to have market power?
a. a grocery store in a metropolitan area b. a convenience store in a suburb c. a pub in a college town d. the only gasoline station in a rural area