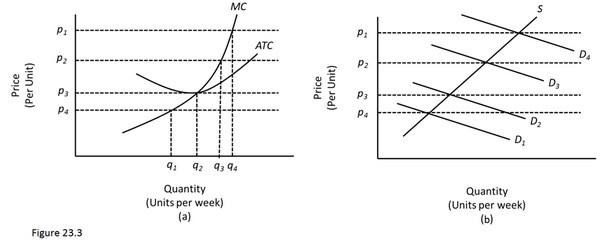
 In Figure 23.3, diagram "a" presents the cost curves that are relevant to a firm's production decision, and diagram "b" shows the market demand and supply curves for the market. Use both diagrams to answer the following question: In Figure 23.3, at a price of p1 in the long run
A. P = ATC.
B. Firms will enter the market.
C. Economic profits equal zero.
D. Firms will exit the market.
Answer: B
You might also like to view...
The effect on the aggregate demand curve of which of the following is most similar to the effect of a decrease in the barriers to efficient functioning of financial markets?
A) a decrease in autonomous investment B) a decrease in the inflation rate C) an autonomous loosening of monetary policy D) a decrease in expected inflation E) a negative price shock
If the marginal product of capital is greater than the rental cost of capital in terms of goods and services, then ________
A) the firm should continue to produce using that same amount of capital B) the firm should add additional capital C) the firm should reduce the amount of capital is using D) diminishing returns have been avoided
Fiscal policy refers to
A) efforts to balance a government's budget. B) changes in the money supply to achieve particular economic goals. C) changes in government expenditures and taxation to achieve particular economic goals. D) the change in private expenditures that occurs as a consequence of changes in government spending.
Economists believe the most persuasive argument for protectionism is to
A) save jobs. B) protect high wages. C) protect national security. D) protect infant industries.