Plot and interpret the appropriate scatter diagram.The table shows the study times and test scores for a number of students. Draw a scatter plot of score versus time treating time as the independent variable. 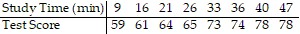 Effect of Study on Test Score
 Time (min)
A. Effect of Study on Test Score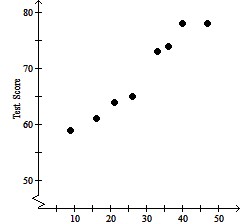
| Time (min) |
test scores.
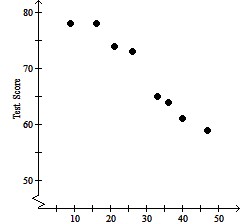
B. Effect of Study on Test Score

| Time (min) |
test scores.
C. Effect of Study on Test Score
| Time (min) |
test scores.
D. Effect of Study on Test Score

| Time (min) |
test scores.
Answer: A
Mathematics
You might also like to view...
Convert 3 m to centimeters.__________ cm
Fill in the blank(s) with the appropriate word(s).
Mathematics
Estimate the fraction as 0,  , or 1.
A. 0
B. 1
C. 
Mathematics
Use the appropriate geometric formula to determine the missing dimension (radius, length, or height).Use 3.14 for ?. Round to the nearest hundredth when appropriate.A box with a surface area of 45 square feet with width 2 feet and length 3 feet.
A. h = 7.8 ft B. h = 3.3 ft C. h = 5.7 ft D. h = 6.6 ft
Mathematics
Answer the question or give an explanation.List and explain at least six parts of a check. Draw a sketch showing where the parts appear.
What will be an ideal response?
Mathematics