Solve the problem.The following Venn diagram describes the cars on a used car lot. Use it to determine how many cars on the lot are not red.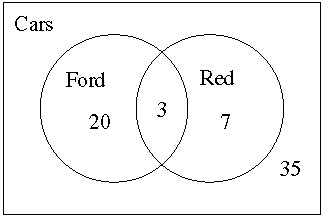
A. 55
B. 58
C. 38
D. 35
Answer: A
Mathematics
You might also like to view...
Sketch the graph of a function y = f(x) that satisfies the given conditions.f(0) = 0,  f(x) = 0,
  f(x) = -?,
 f(x) = -?,
  f(x) = ?,
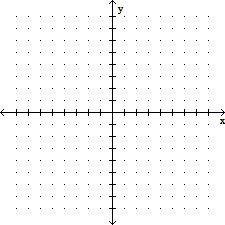
height="225" width="225" /> What will be an ideal response?
Mathematics
The circle graph shows the results of the student council presidential election. The complete circular area represents 100% of the votes. The circle graph shows what percent of the vote each person received.How many votes did Ann get?
A. 144 B. 132 C. 216 D. 108
Mathematics
Write a fraction to represent the shaded portion of the figure.![]()
A. 
B. 
C. 
D. 
Mathematics
Solve.Find the area and perimeter of the figure:

A. area: 25 m2; perimeter: 20
 m
m
B. area: 25 m2; perimeter: 20
 m
m
C. area: 27 m2; perimeter: 20
 m
m
D. area: 10 m2; perimeter: 20
 m
m
Mathematics