The following comparison line graph indicates the number of vehicles sold for a seven week period by two different salespeople. Use the graph to answer the question.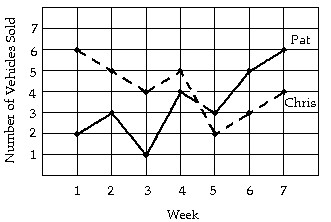 In the fifth week, how many vehicles did Pat sell?
A. 3 vehicles
B. 5 vehicles
C. 4 vehicles
D. 2 vehicles
Answer: A
Mathematics
You might also like to view...
Evaluate the spherical coordinate integral.
A.  ?
?
B.  ?
?
C.  ?
?
D.  ?
?
Mathematics
Graph the inequality.x + 5y ? -5
A. 
B. 
C. 
D. 
Mathematics
Write the decimal as a fraction or mixed number in lowest terms.0.24
A. 
B. 
C. 
D. 
Mathematics
Select the correct graph of the given function.
?
 ?
?
A. ?
B. ?
C. ?
D. ?
E. ?
Mathematics