The diagram below represents a model that the U.S. Geological Survey (USGS) uses to categorize the extent of storm surge in the coastal zone. The red arrow in this figure points to
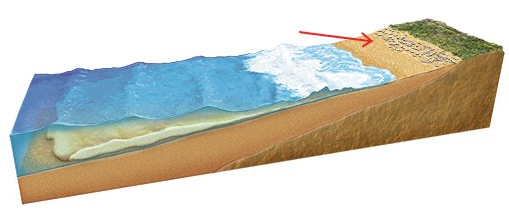
A) the maximum height of the swash zone.
B) the highest rate of discharge from the nearest stream.
C) the radius of motion of water molecules that are part of the waves of oscillation.
D) the height of high tide.
A) the maximum height of the swash zone.
You might also like to view...
At which time does sunlight pass through a thicker portion of the atmosphere?
A. sunrise and sunset B. sunset and night C. noon and night D. sunrise and noon
The zone of saturation extends to an indefinite depth
Indicate whether the statement is true or false
The future use of photovoltaics is likely to
A) increase, because they can be adapted to meet a variety of needs B) increase, because the energy is less expensive than that generated by fossil fuels C) decrease, because they have proven to be inefficient D) decrease, because they require large, centralized generating facilities
If a surface absorbs insolation
A) its temperature increases. B) diffuse radiation occurs. C) its temperature is unaffected. D) its temperature decreases. E) refraction occurs.