Refer to the information provided in Figure 2.4 below to answer the question(s) that follow.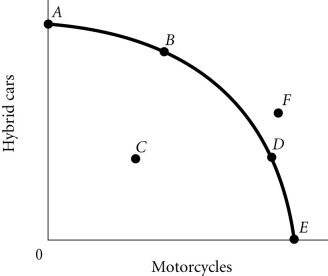 Figure 2.4According to Figure 2.4, a decrease in unemployment may be represented by the movement from
A. B to A.
B. C to D.
C. B to D.
D. A to C.
Answer: B
You might also like to view...
By producing at the point where MR = MC, the firm:
a. is guaranteed a profit. b. will earn a profit of zero. c. will lose money. d. profit is maximized. e. output.
Consumer surplus:
a. does not exist in equilibrium. b. is illustrated by the area under the demand curve and above the market price. c. is illustrated by the area under the demand curve and below the market price. d. is illustrated by the area above the supply curve and under the demand curve.
The supply curve for housing in the very short run is likely to be
A) very elastic. B) very inelastic. C) unit-elastic elastic. D) perfectly elastic.
Economic models
A) are used to explain how people think. B) are used to explain how people behave. C) are essential representations of the real world. D) are used to explore the thought processes of individuals or groups.