Use the following graph for a competitive market to answer the question below. Assume the government imposes a $3 tax on buyers, which results in a shift of the demand curve from D1 to D2. The price the seller receives for the product after the tax is imposed on the buyer is
A. $7.
B. $5.
C. $8.
D. $3.
Answer: B
You might also like to view...
In Econland total output is $6 billion, population equals 250,000 people, and, of these, 200,000 are employed workers. Output per person in Econland equals ________ and average labor productivity equals ________.
A. $30,000; $30,000 B. $24,000; $24,000 C. $30,000; $24,000 D. $24,000; $30,000
Kayla decides that she would pay as much as $400 for a new refrigerator. She buys the refrigerator and realizes consumer surplus of $75 . How much did Kayla pay for her refrigerator?
a. $75 b. $325 c. $400 d. $475
If the full-employment level of income in Figure 9.7 is $200 billion, there is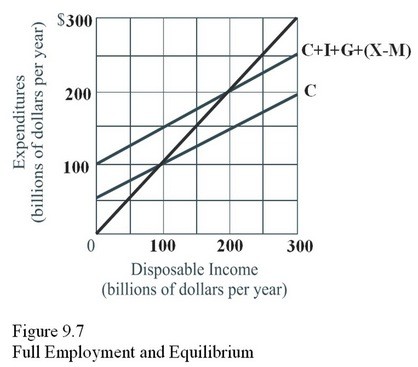
A. A recessionary gap of $100 billion per year. B. An inflationary gap of $100 billion per year. C. A recessionary gap of $200 billion per year. D. Achievement of macro equilibrium.
Refer to the information given. In the long run, a fall in the price level from 100 to 75 will:
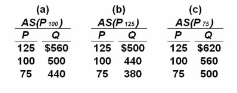
Suppose the full employment level of real output (Q) for a hypothetical economy is $500, the
price level (P) initially is 100, and prices and wages are flexible both upward and downward.
Use the following short-run aggregate supply schedules to answer the question.
A. decrease real output from $500 to $440.
B. increase real output from $500 to $620.
C. change the aggregate supply schedule from (a) to (c) and produce an equilibrium level of
real output of $500.
D. change the aggregate supply schedule from (a) to (b) and produce an equilibrium level of
real output of $500.