Analyze the graph of the given function f as follows:(a) Determine the end behavior: find the power function that the graph of f resembles for large values of |x|.(b) Graph f using a graphing utility.(c) Find the x- and y-intercepts of the graph.(d) Use the graph to determine the local maxima and local minima, if any exist. Round turning points to two decimal places.(e) Use the information obtained in (a) - (d) to draw a complete graph of f by hand. Label all intercepts and turning points.(f) Find the domain of f. Use the graph to find the range of f.(g) Use the graph to determine where f is increasing and where f is decreasing.f(x) = -3x4 + ?x3 -  x + 4
x + 4
What will be an ideal response?
(a) For large values of |x|, the graph of f(x) will resemble the graph of y = -3x4.
(c) y-intercept: (0, 4), x-intercepts: (-1.03, 0) and (1.20, 0)
(d) Local maximum at (-0.43, 4.79); no local minima
(e) 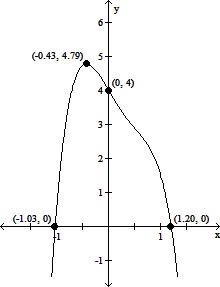
(f) domain of f: all real numbers; range of f:  ,
,
(g) f is increasing on (-?, -0.43); f is decreasing on (-0.43, ?)
Mathematics
You might also like to view...
Provide an appropriate response.Look for a pattern in the sequence of figures shown below, and use your reasoning to draw the next figure.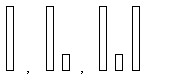
A. 
B. 
C. 
D. 
Mathematics
Graph the function.f(x) = |x| + 4
A. 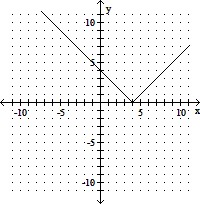
B. 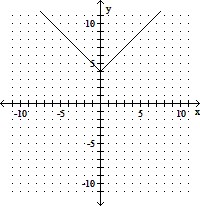
C. 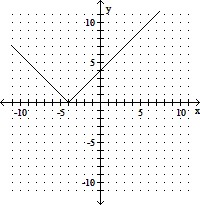
D. 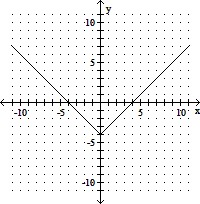
Mathematics
Use the product rule to multiply. Assume all variables represent positive real numbers. ?
? 
A. 7x2y2
B. 7x2y2
C. 49x2y2
D. 7x3y3
Mathematics
Graph.(x - 1)y = 1
A. 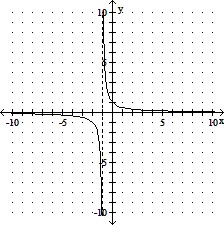
B. 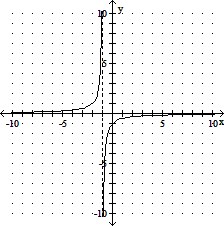
C. 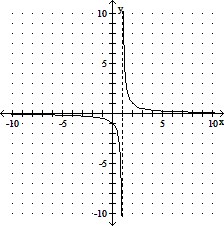
D. 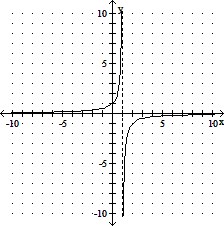
Mathematics