Given the budget line in the above figure, what is the relative price of pizza?
A) 10 gallons of milk per pizza
B) 6 gallons of milk per pizza
C) 4 gallons of milk per pizza
D) 2 gallons of milk per pizza
D
You might also like to view...
Use the following figure to answer the next question.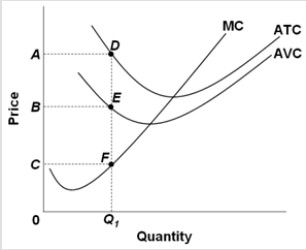 If the firm is producing at Q1, the area BADE represents the
A. average variable cost. B. total variable cost. C. total fixed cost. D. total cost.
A firm's average variable cost is $90, its total fixed cost is $10,000, and its output is 1,000 units. Its total cost is
A) less than $85,000. B) between $85,000 and $95,000. C) between $95,000 and $105,000. D) more than $105,000.
Consider the indifference maps shown above. If X and Y are perfect substitutes, your indifference curves between them would look like those in
A) Figure A. B) Figure B. C) Figure C. D) Figure D.
This theory views shocks to tastes (workers' willingness to work, for example) and technology (productivity) as the major driving forces behind short-run fluctuations in the business cycle because these shocks lead to substantial short-run
fluctuations in the natural rate of output. A) the natural rate hypothesis B) hysteresis C) real business cycle theory D) the Phillips curve model