Figure 8-1
?
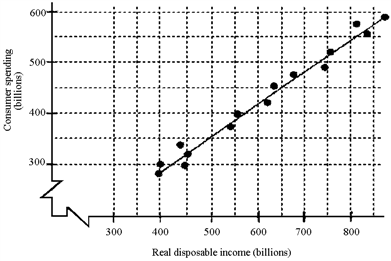
Based on the scatter diagram in Figure 8-1, if real disposable income is $800 billion, the consumption spending would be approximately
A. $800 billion.
B. $650 billion.
C. $540 billion.
D. $420 billion.
Answer: C
You might also like to view...
The gross replacement rate is
A. the proportion of pretax earnings replaced by unemployment insurance. B. a rate of employment in key sectors of the economy. C. the percentage of each paycheck that is removed for unemployment insurance. D. the rate that tax receipts are used to cover tax expenditures. E. none of these answer options are correct.
Endogenous variables
A) are correlated with the error term. B) always appear on the LHS of regression functions. C) cannot be regressors. D) are uncorrelated with the error term.
When the firm produces zero output, its variable cost is
a. zero b. the same as total cost c. the same as fixed costs d. the same as price e. infinite
Summarize the production costs of a business
What will be an ideal response?